Two superpowers once launched almost everything that reached orbit. Drag through six decades of the complete launch record and watch their grip loosen under your hand, as China, Europe and a new kind of company crowd the sky.
The hook
After six decades, a new country led the launch table
In 2018, for the first time in the entire history of spaceflight, the country that sent the most rockets to orbit was neither the United States nor Russia. It was China. The headline that made the moment — the space race is dominated by new contenders — was not about a single year so much as the end of an arrangement that had held since the beginning.
That arrangement was a duopoly. Through the 1960s the United States and the Soviet Union together launched about 99% of everything that reached orbit; every other nation on Earth was a rounding error. The interesting question is not that they were dominant — it is what is left of that dominance now, and the cleanest way to feel the answer is to watch it move year by year.
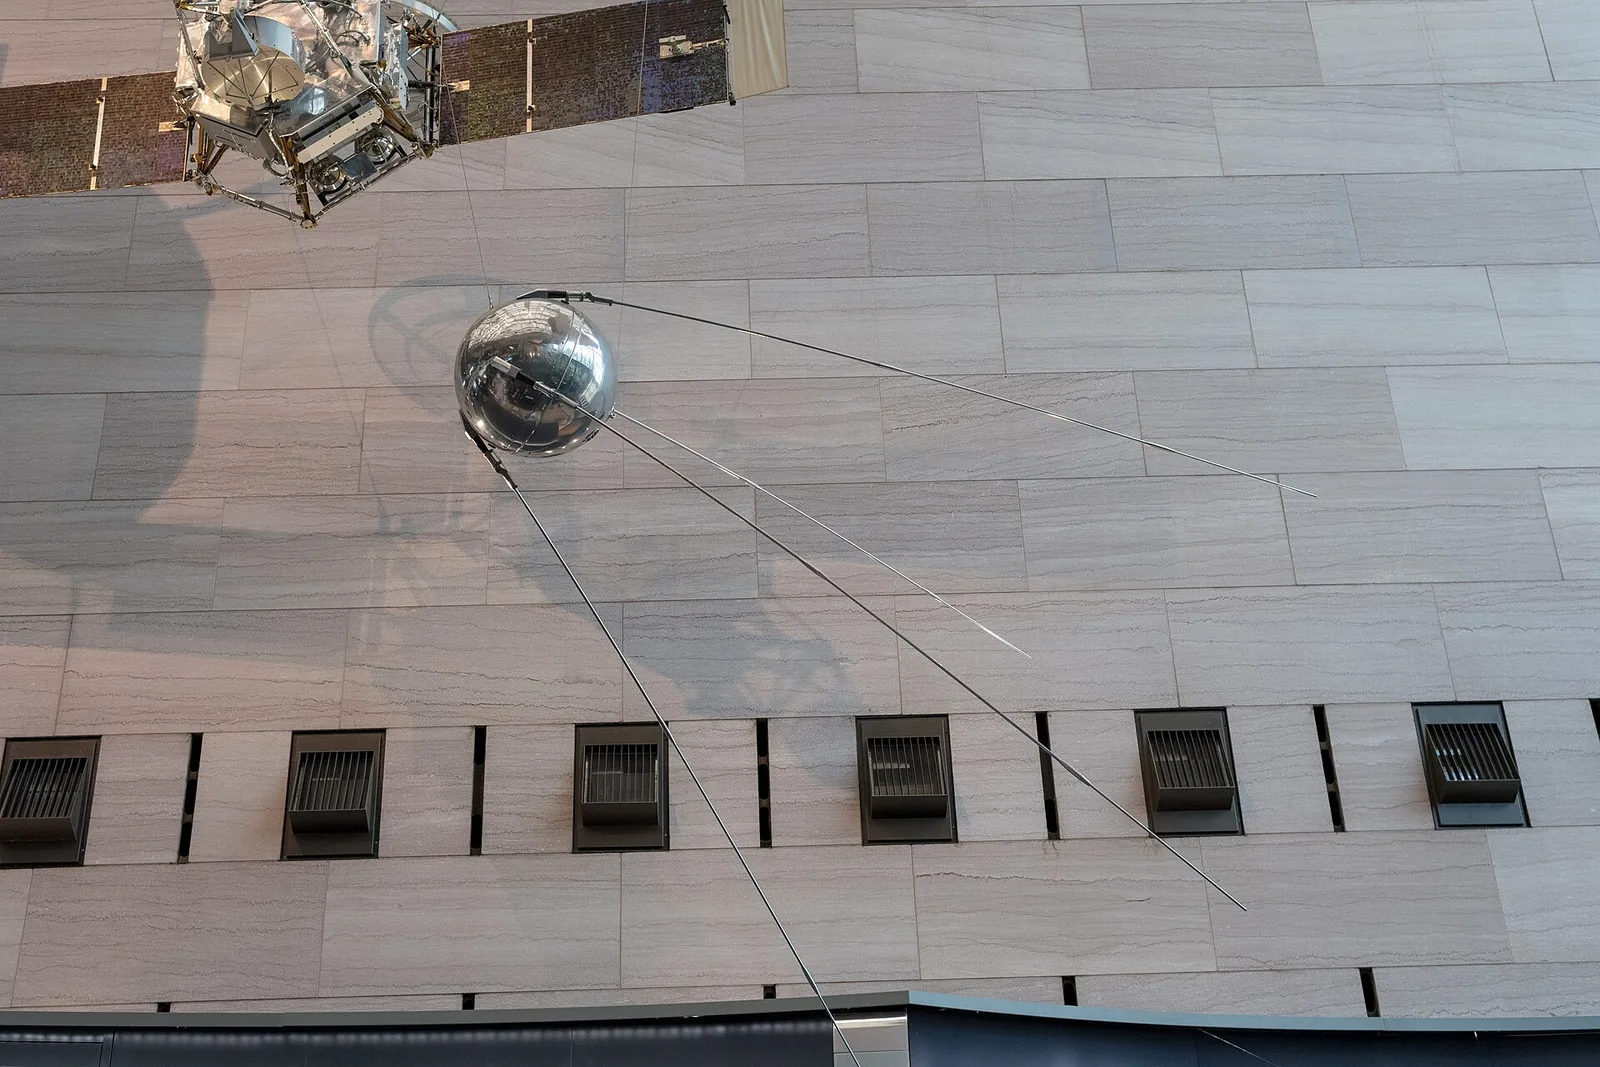
The record this rests on is unusually complete. It is a census, not a sample: 5,726 orbital launch attempts from the very first one — Sputnik, on 4 October 1957 — through October 2018, drawn from Jonathan McDowell's JSR catalog, of which 5,384 succeeded, a 94.0% success rate across 62 years. (One mistyped launch date, "2918," was corrected to 2018.) Every launch ever attempted is in here.
Context
Two superpowers, and a workhorse that flew 632 times
The story opens as a straight duel. The data's first rows are American and Soviet, and through the early 1960s the two traded the lead launch by launch — the only two players in the game they had just invented.
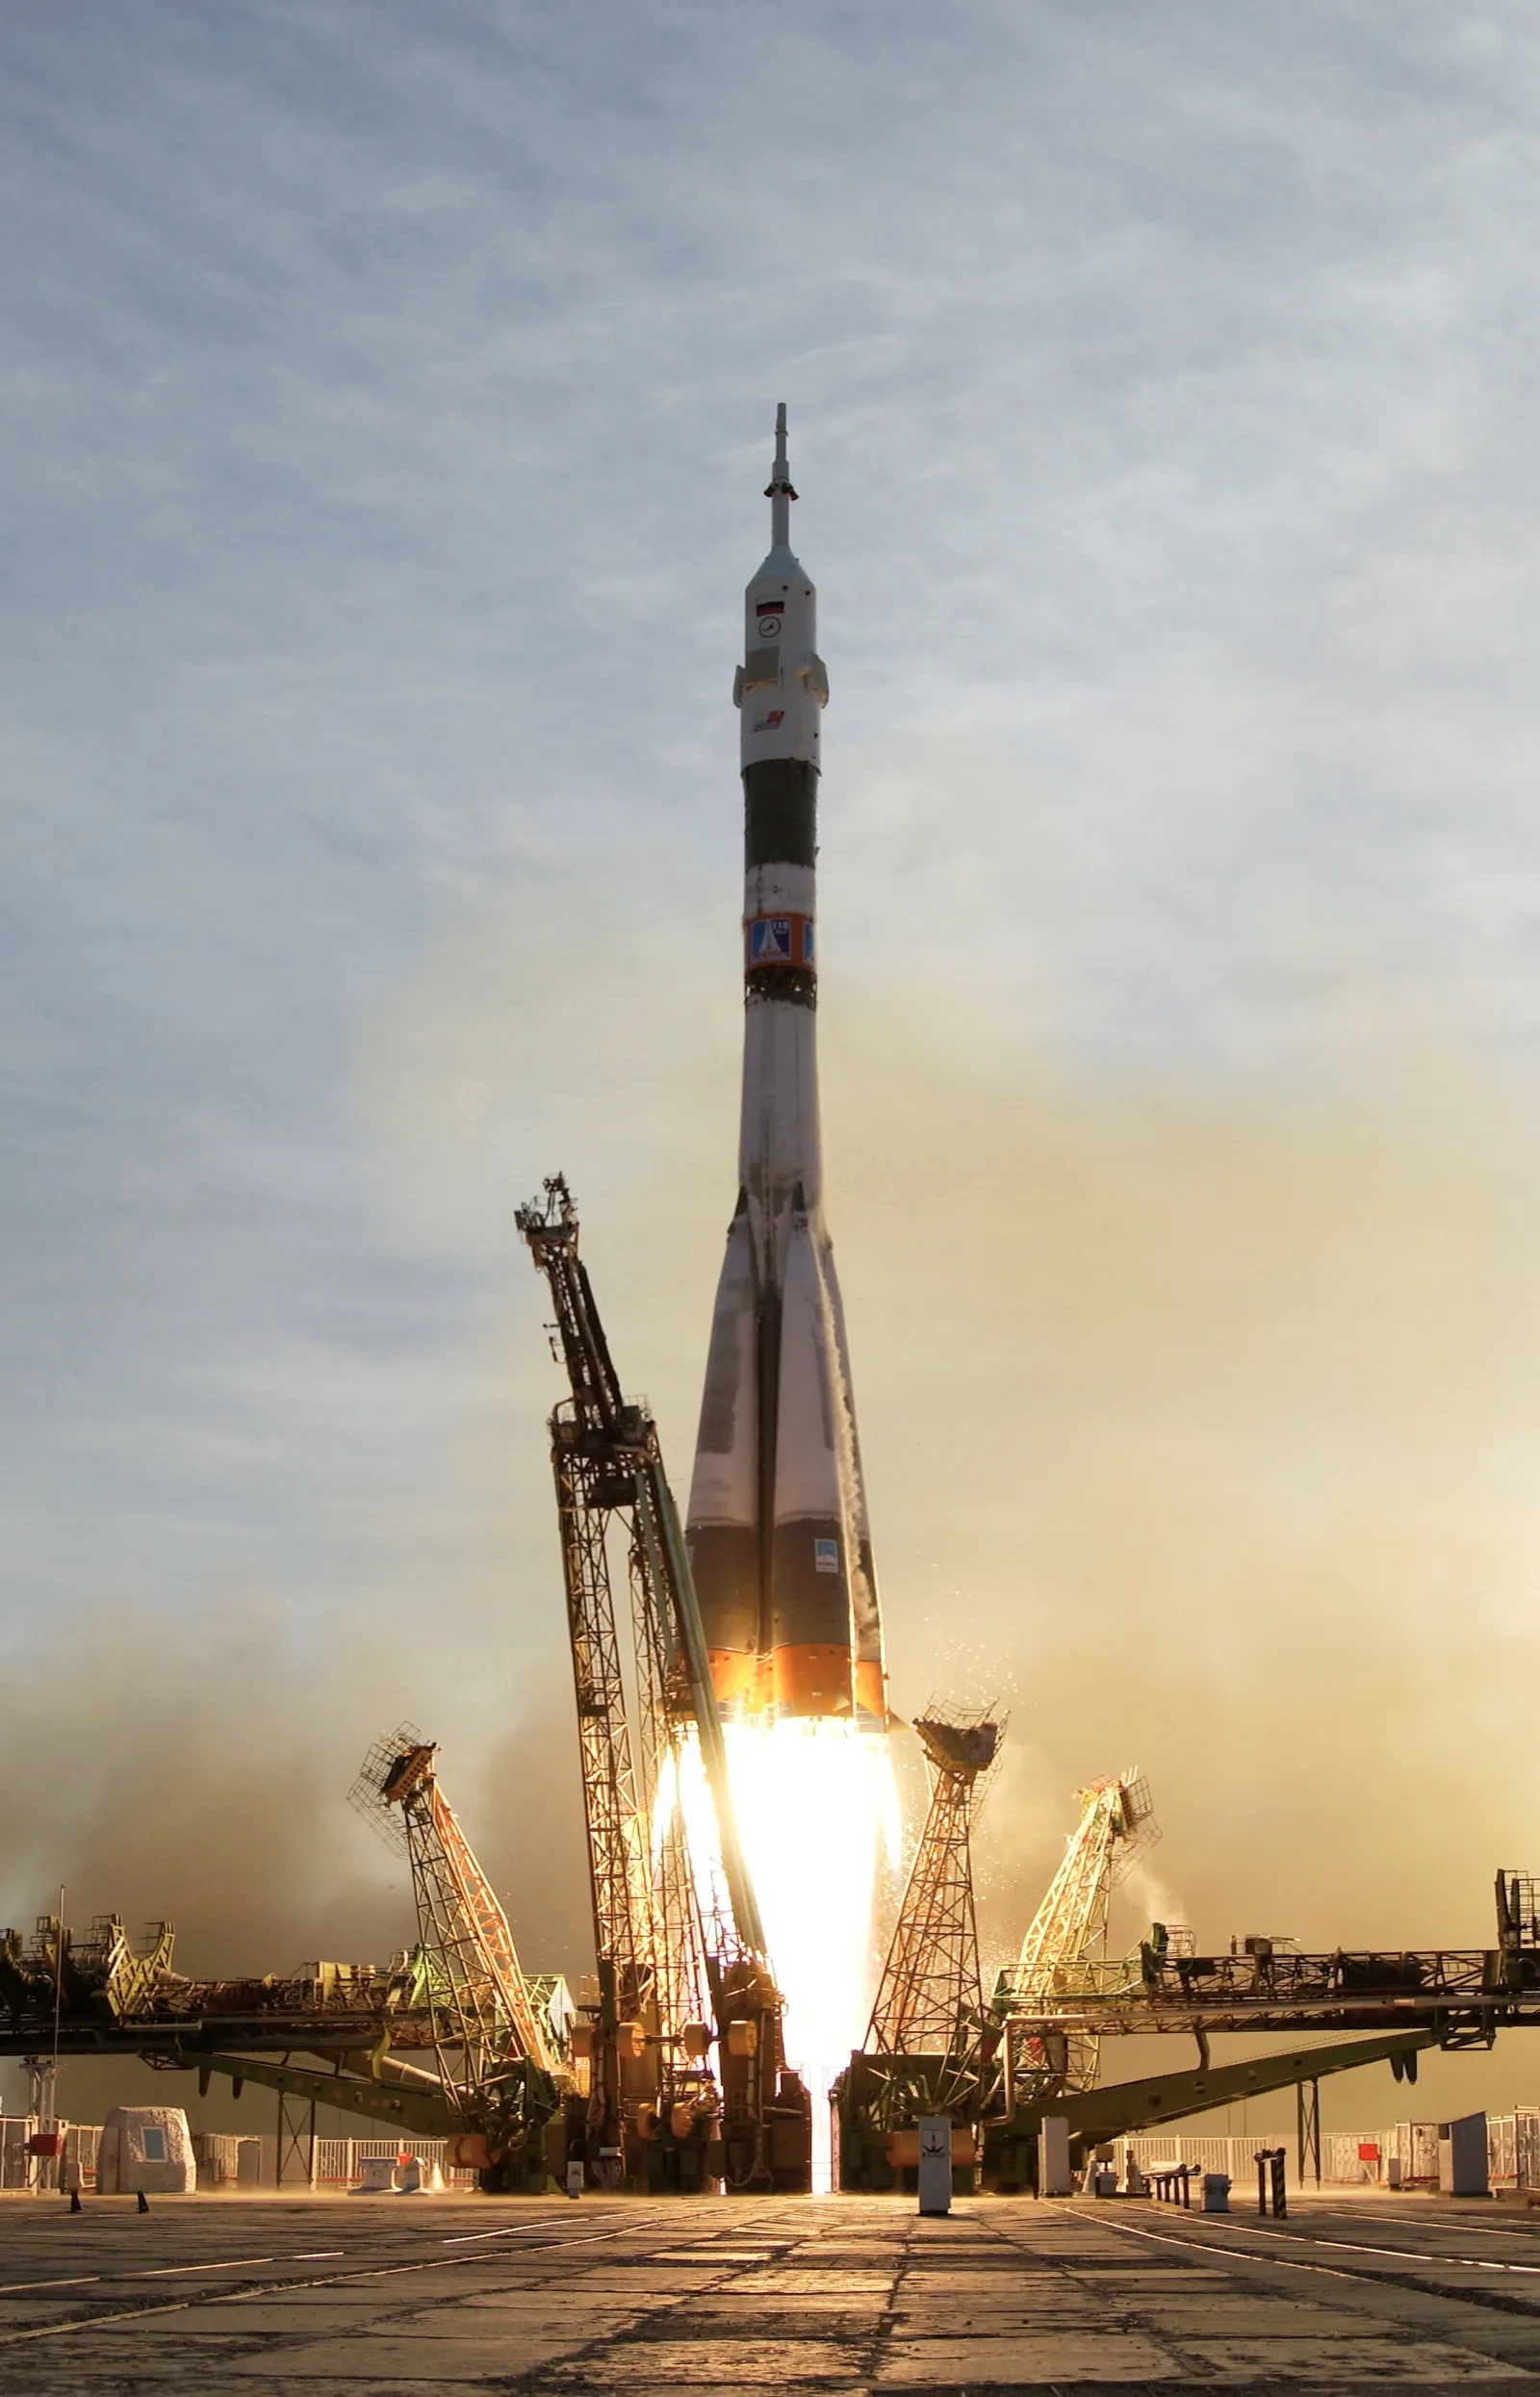
Then the Soviet Union pulled away and stayed ahead for two decades. At the Soviet peak in 1982 it launched 108 of the year's 129 rockets on its own. The reason is mundane rather than heroic: the "Kosmos" label covered a fleet of short-lived military satellites that had to be replaced constantly, all flown on the R-7/Soyuz family — cheap, reliable, mass-produced hardware launched very often.
The fingerprints are still in the all-time list of individual vehicles: the single most-flown rocket in history is the Soviet Soyuz-U, with 632 launches, and the next several are Soviet too. Volume, in this dataset, has a strong Russian accent.
Then the floor fell out. Launch volume peaked by decade in the 1970s (1,226 launches) and held through the 1980s (1,191), before the Soviet collapse cut Russian space funding by roughly 80%, cancelled the Buran shuttle, and left the main launch site stranded in newly independent Kazakhstan. Global volume sagged to 889 in the 1990s and a 650 trough in the 2000s; the Soviet "SU" code simply disappears after 1991.
The turn
What changed was who, not how much
Here is the first thing the data refuses to confirm: a launch boom. Total launches a year ran at a Cold-War cruising altitude of roughly 100 to 140 from the mid-1960s to 1990 — the single busiest year on record is 1967, with 139 — then fell and has only partly recovered, to around 80 to 90 a year in the 2010s. Across six decades the "how much" line is essentially flat-to-down. (2018 reads 80, but the data stops in October; the true full-year total was 114.)
So if the sky is not getting busier, what exactly changed? Drag the years below and watch.
99.2% of 1965's launches were USA + USSR/Russia Leader: USA · 3 countries launched this year
What you produce is the cleanest measure of the whole story. The two superpowers' combined share of all launches falls from about 99% in the 1960s to 54.5% in the 2010s; a concentration index drops in step from roughly 6,600 toward 2,200; and the number of countries launching in a given decade rises from two to seven. The United States never collapsed — its share even recovered after the 1990s. It simply stopped being one of only two.
By the 2010s, for the first time since the 1950s, no single bloc holds a majority of the world's launches. A duel became a crowd.
New contenders · Part one
How one rocket family carried China to the front
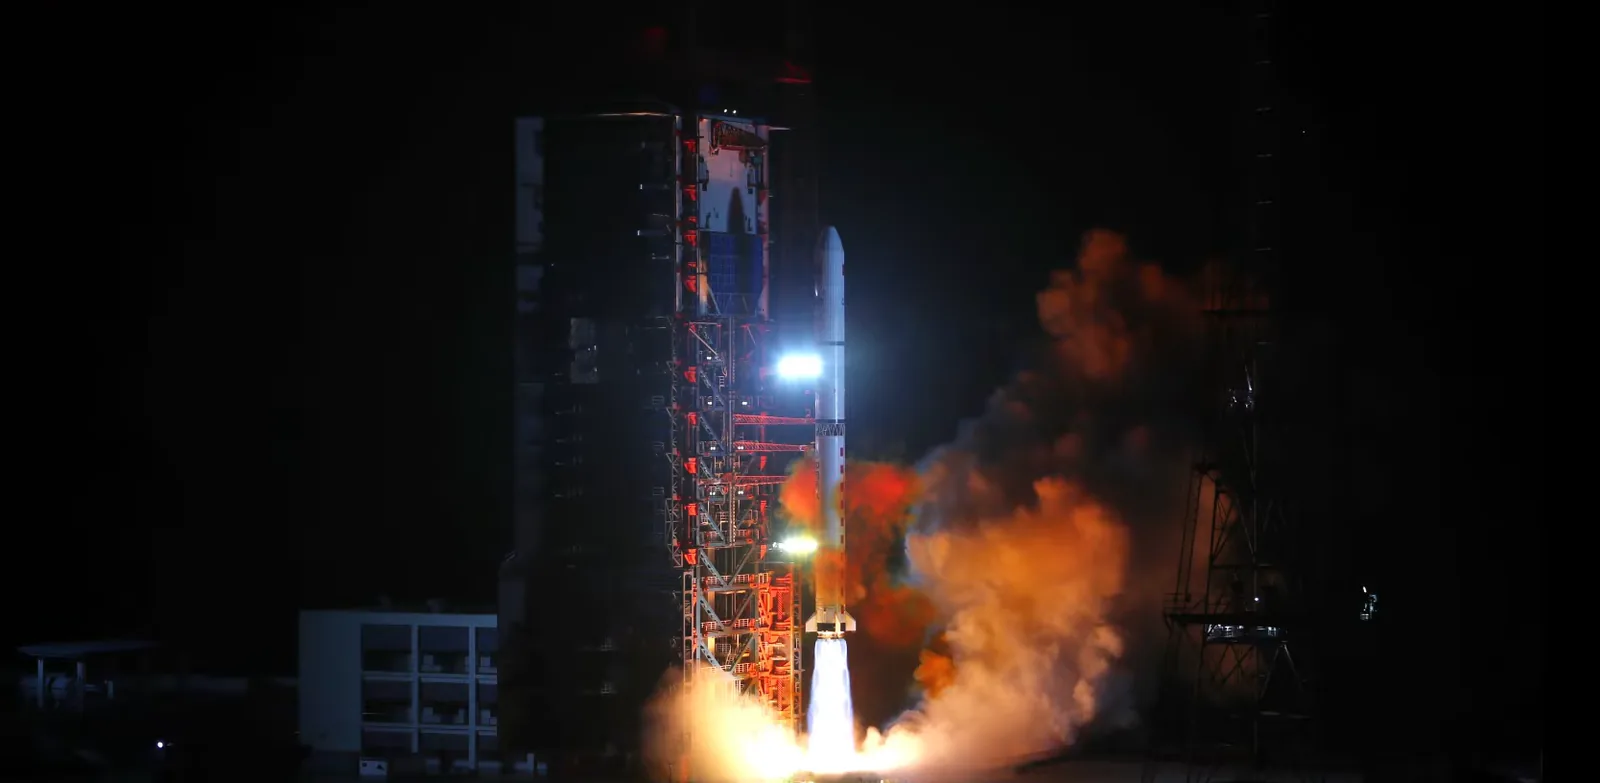
The crowd has a clear protagonist. China's launches climb decade on decade — 13 in the 1970s, 15 in the 1980s, 39 in the 1990s, 64 in the 2000s, and 171 in the 2010s — from the nation that put up its first satellite only in 1970 to the one at the top of the table.
The crossover lands in 2018. In this dataset's partial year — it runs January to October — China already leads with 28 launches to the United States' 27 and Russia's 10. Counted over the full calendar year by external records, the margin widens to 39, 34, and 20. Read the 28-to-27 as the snapshot it is, not a final tally; either way, 2018 is the year the order changed.
And China's rise is, almost literally, one rocket. 287 of its 302 launches — 95% — are Long March (Chang Zheng) vehicles. Where the American fleet is a market of Thor, Atlas, Titan, Shuttle, and now Falcon, China's ascent is a single sovereign family scaled up. Guess how concentrated before the chart tells you.
Earn the trust
Three ways to count 2018, and China leads them all
The honest weakness of the headline is the calendar. This dataset's 2018 is truncated — 80 launches, ending in October, against a full-year total of 114 — so laying partial-2018 next to complete earlier years would understate it and could manufacture a "decline" that isn't there. The crossover claim has to earn the comparison.
China, projected full year: 33.6 launches (naive ×12 ÷ 10 months) — external actual: 39
A naive linear pro-rate, not a forecast. It validates a per-year count crossover, not ownership of space.
It does, three ways over. China leads in the data's own partial window (28 to 27); it still leads if you naively pro-rate that window to a full year (about 33.6 to 32.4); and it leads in independent year-end records that never touched this file (39 to 34). Across all 62 years China is the single largest launcher in exactly one — 2018 — so this is a genuine first, not a recurring wobble. Set the months elapsed yourself and watch the projection move against the real number. What it does not prove is that China now owns space; that is a claim about one year's count, and the all-time ledger tells a very different story.
The counter-tension
More than half of every launch ever was Soviet or Russian
Run the tally over the whole era and the Cold War is still winning. Cumulatively, the USSR/Russia lineage accounts for 3,178 launches — 55.5% of every orbital launch in history — and the United States for another 1,716 (30.0%); together, 85.5% of everything ever flown. Europe's all-time count (307) even noses ahead of China's (302). The per-year crowd has not yet rewritten history; it has only started writing the next chapter.
85.5% of all launches through 2018 flown by USSR/Russia + USA
The same gap shows in the hardware. Grouped into families, the Soviet/Russian fleet — R-7/Soyuz (1,832), Kosmos (621), Proton (411) and more — exceeds 3,200 launches. Against that, China's Long March stands at 287 and SpaceX's Falcon at 68: formidable, modern, and almost entirely concentrated in the final decade of the data, but not yet voluminous.
Where those launches come from maps cleanly onto a handful of countries, with the Soviet/Russian and American programs dominating the fill. (A launch-site point map is not possible here — the coordinates in the source are blank — so geography is a country-level view, not a scatter of pads.)
Honest twist
China reaches orbit 95.7% of the time, matching the incumbents
The other reflex about a rising challenger — that it must be buying its place with cheaper, riskier rockets — also fails. Every major launching power sits in a tight, high band: Europe at 95.8%, China at 95.7%, the USSR/Russia at 95.2%, the United States at 92.4%, Japan at 92.2%, India at 89.2%. China's reliability ties the incumbents almost exactly. Pick a country and check it yourself.
95.7% success rate — 289 of 302
Sorted by kind of operator, the surprise runs the other way. The most reliable launches in the data are not the state programs but the established commercial providers — the Arianespace-led "private" category, at 97.4% — ahead of state programs (93.4%) and the venture "startups" (92.9%, on a thin base of 70 launches that still carries SpaceX's three early Falcon 1 failures). Old does not mean shaky, and new does not mean reckless.
Reliability, in fact, stopped being the interesting variable decades ago: it climbed from 46% in the experimental 1950s to a 97.1% peak in the 1980s and has held near 96% ever since. Reaching orbit is now routine; who does the reaching is the open question.
New contenders · Part two
A venture-funded startup now launches like a national programme
The second new contender is not a country at all. Commercial launch is not actually new — Europe's Arianespace pioneered it in 1984, and the "private" category peaked at 46.9% of all launches in the 2000s. What is new is the next wave: a "startup" class that appears in the record only from 2006.
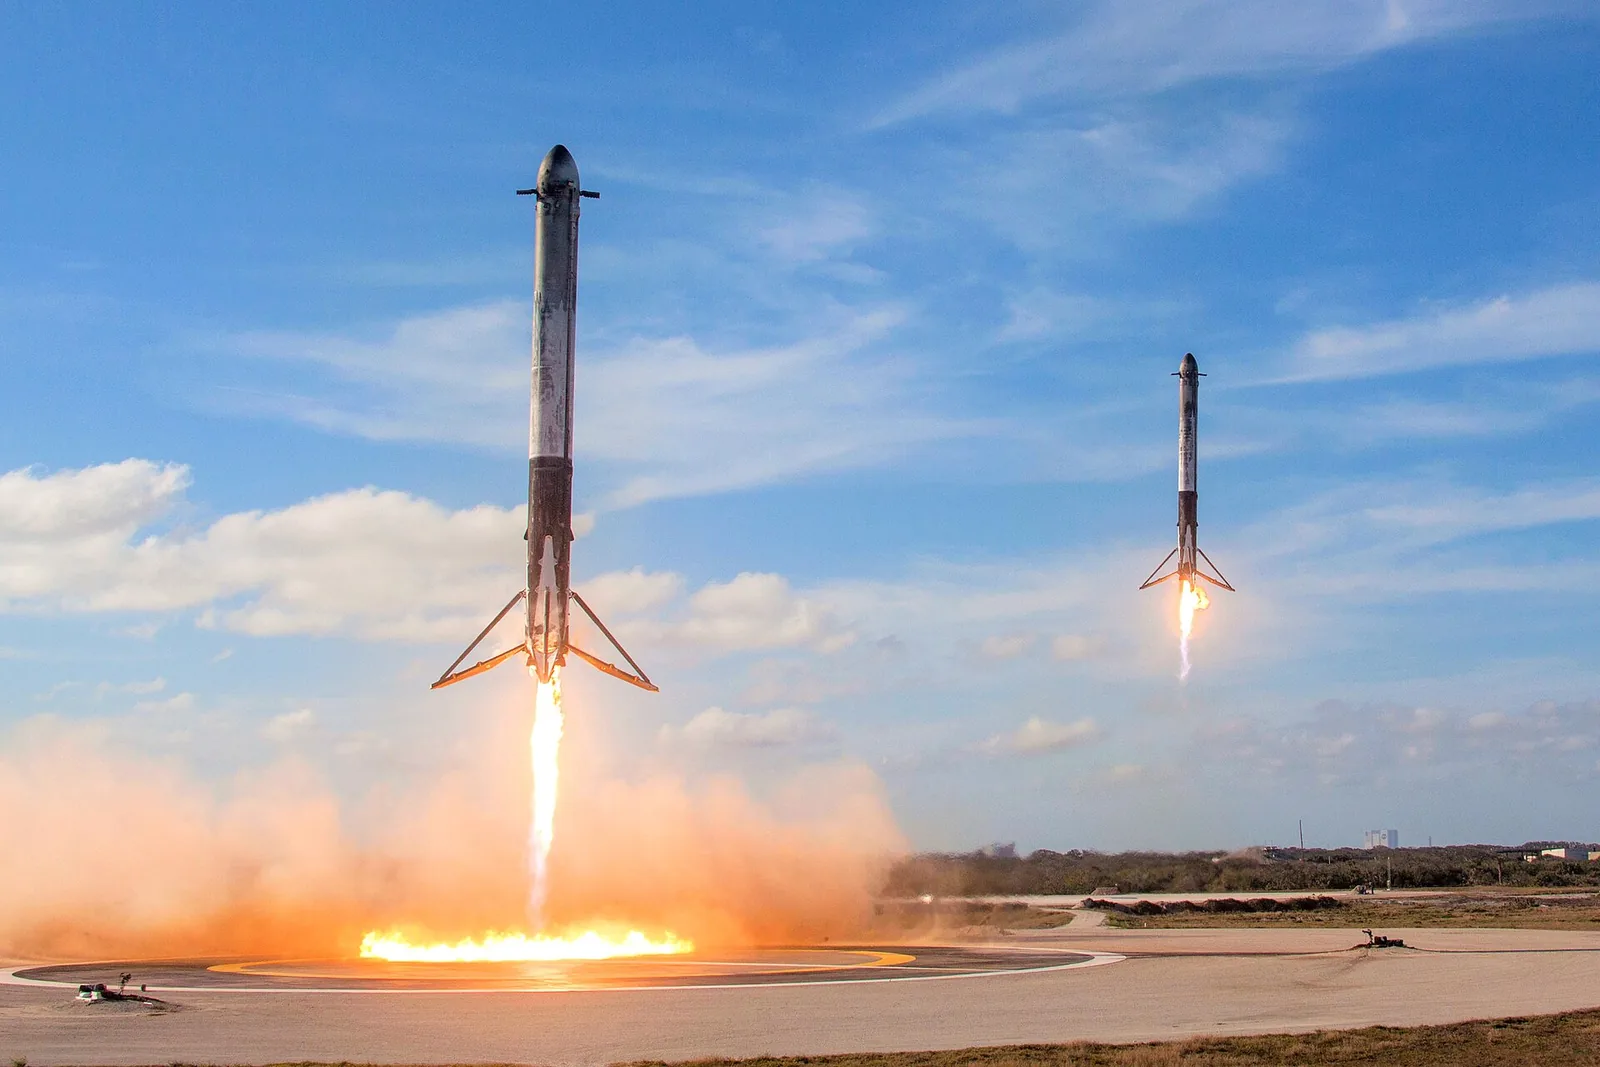
In this data that class is essentially SpaceX — 68 launches (Falcon 9 62, Falcon 1 5, Falcon Heavy 1) — plus Rocket Lab's two early Electron flights. Its cadence ramps from a single launch in 2006 to 19 in 2017 and 18 in the partial 2018, by which point one venture-funded firm is launching at the rate of a mid-size national program. Falcon Heavy's twin-booster landing in February 2018 falls inside this dataset's window. Guess the year a "startup" first reached orbit before the timeline shows you.
 ▶
Watch on YouTube — SpaceX Falcon Heavy Test Flight (6 Feb 2018)
For context on how recent that really is: before SpaceX, the largest single commercial provider in the world was Arianespace, with 260 launches between 1984 and 2018 — established aerospace, a different species from the venture startups now crowding in beside it.
The close
Which is the future: the per-year crowd, or the all-time duel?
Why any of this matters beyond a leaderboard: who can launch, and how cheaply, decides who controls the satellites that run modern life — communications, navigation, Earth observation, reconnaissance — and the business around them is projected to grow from about $350 billion in 2016 toward more than $1 trillion by 2040. Access to orbit is leverage, and it is diffusing from two hands into many.
Which leaves two true pictures of the same sky. In any given recent year the field is a crowd — seven nations, two commercial waves, no majority holder. Totalled across the whole era it is still a duel won long ago, with 85.5% of every launch in history flown by the two original superpowers. The unresolved question is which picture is the future: does the crowd keep launching until it rewrites the ledger, or does the sheer mass of the Cold-War record hold for another generation?
Sources & method
Data
- The Economist — Graphic Detail data & code ("The space race is dominated by new contenders", 18 Oct 2018). Launch data credited to Jonathan McDowell; the agencies table to McDowell and The Economist.
- Jonathan McDowell — JSR Launch Vehicle Database (Harvard-Smithsonian Center for Astrophysics). Every count here is recomputed from
launches.csvbycode/analyze.py.
Context & benchmarks
- 2018 in spaceflight — full-year 2018: China 39, USA 34, Russia 20 (global 114).
- CSIS ChinaPower — China's space launch — Long March 95.3% success; the >$1 trillion space-economy projection.
- R-7 / Soyuz family · Sputnik (NASA).
Media credits
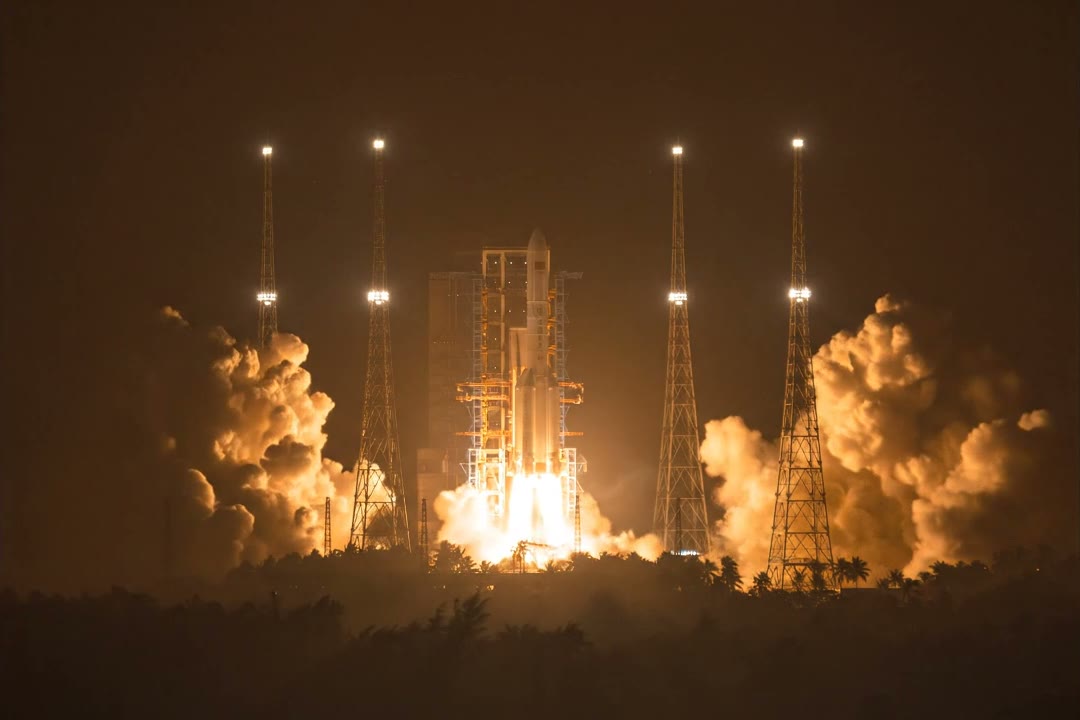
- Hero: Long March 5, Wenchang — Shujianyang / Wikimedia Commons (CC0); motion added as a cinemagraph (not authentic launch footage, not AI video of a person).
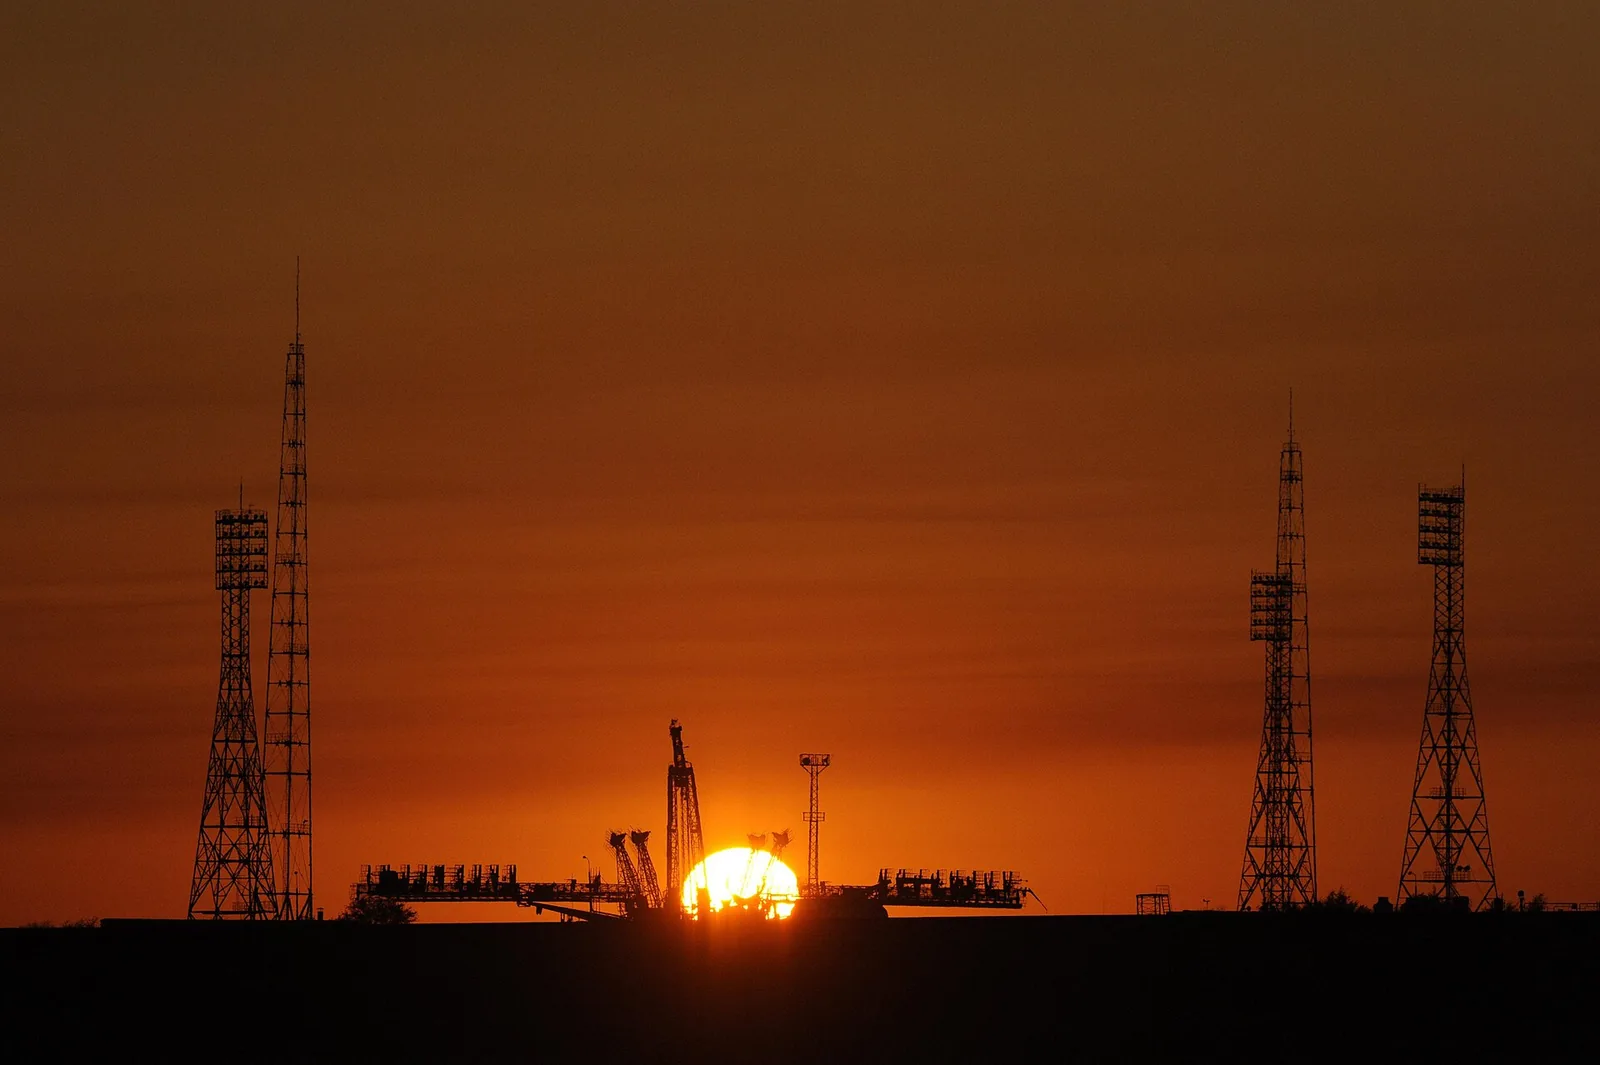
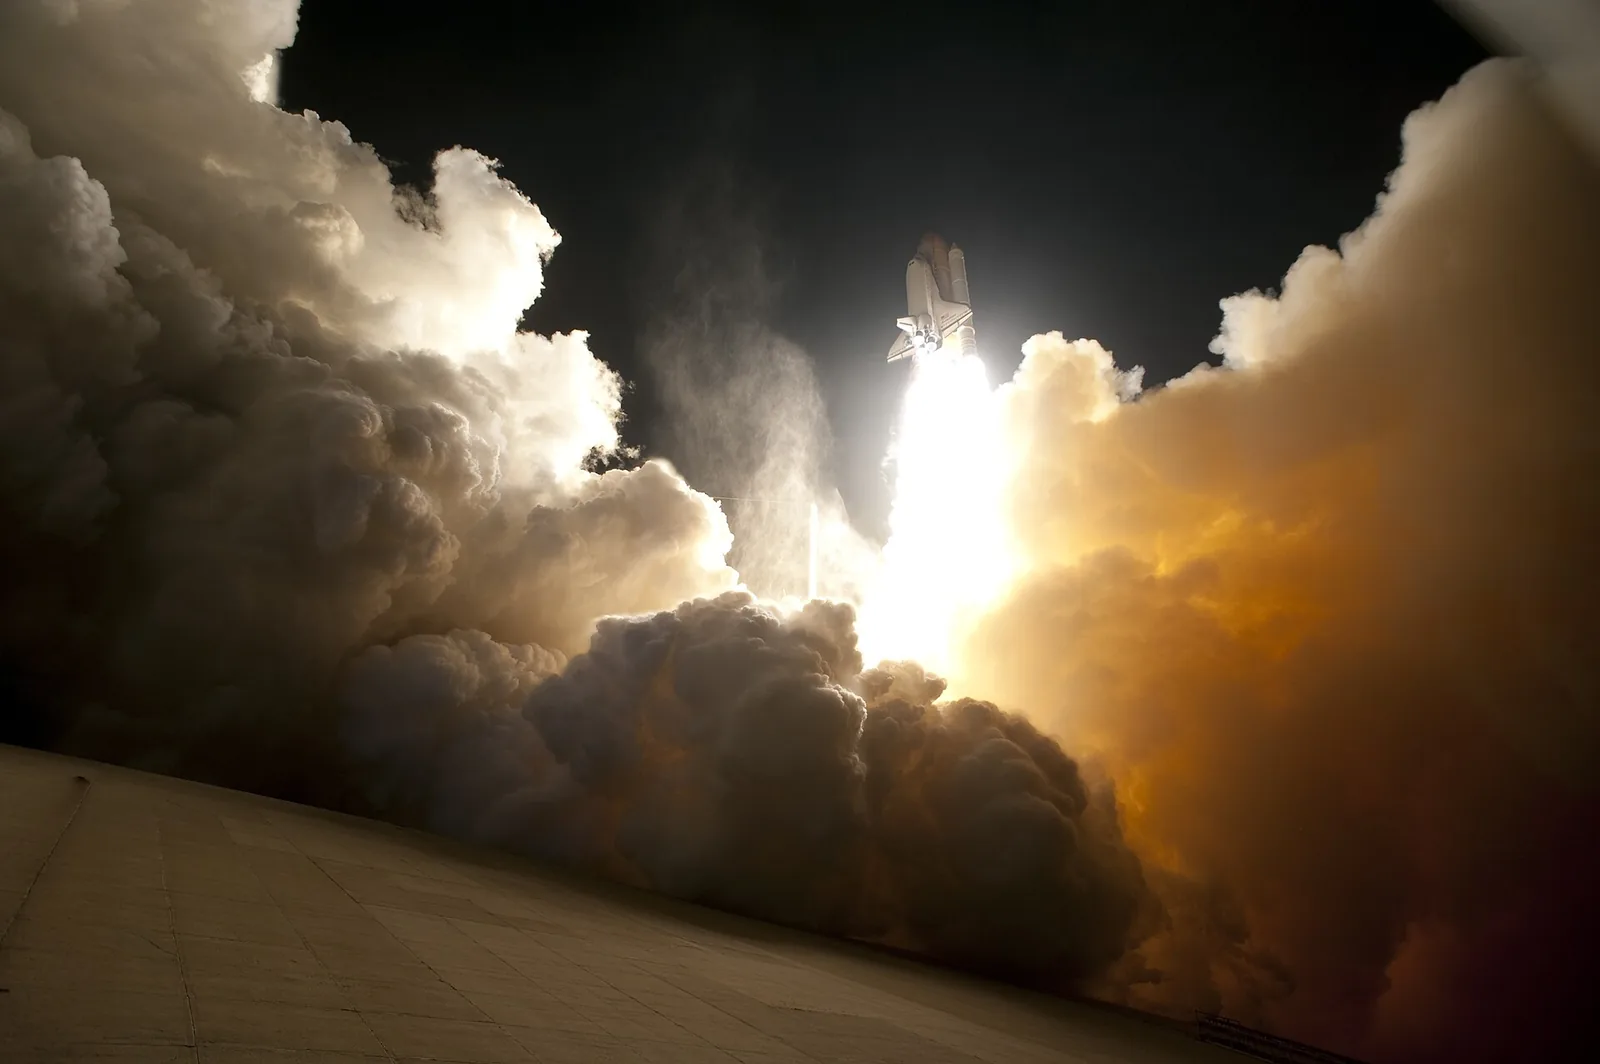
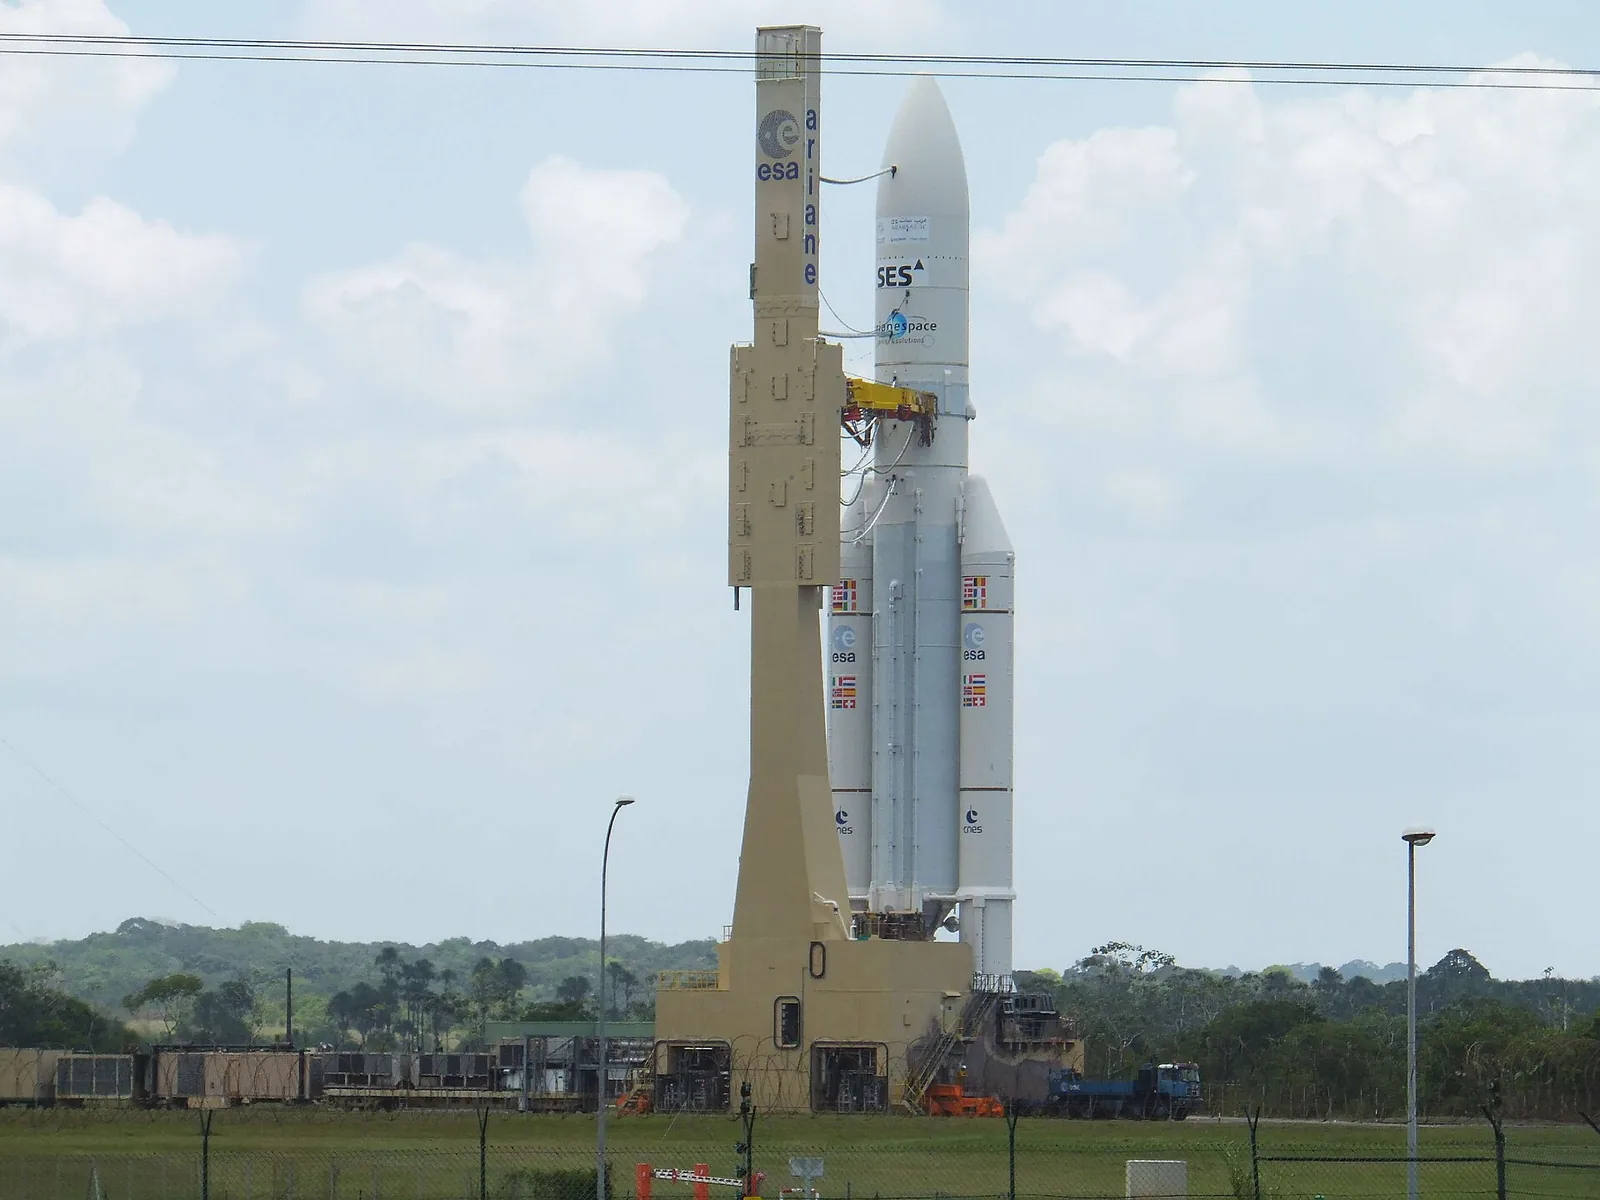
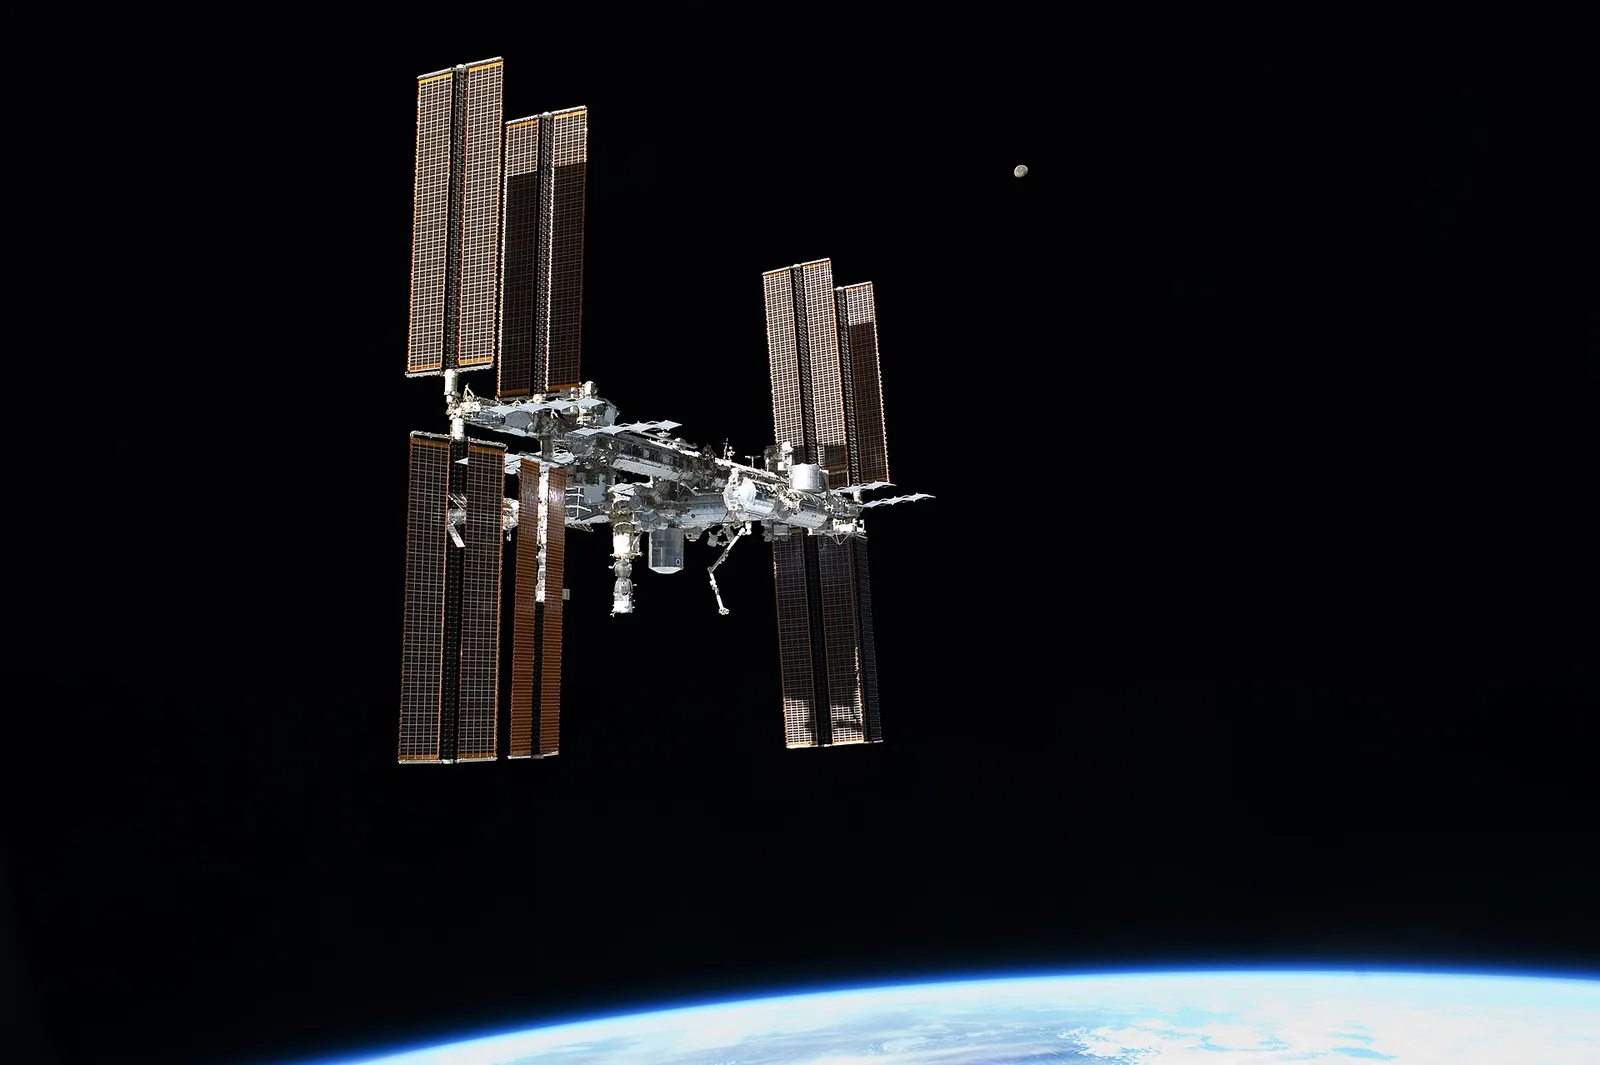
- Music: raspberrymusic / Wikimedia Commons (CC BY 3.0). Photos: Sputnik 1 — Mys 721tx (CC BY-SA 3.0); Soyuz, Baikonur, Space Shuttle, ISS, Earth limb — Bill Ingalls / NASA / Wikimedia Commons (public domain); Long March, Xichang — China News Service (CC BY 4.0); Falcon Heavy boosters — SpaceX / Wikimedia Commons (CC0); Ariane 5, Kourou — elisabetta_monaco (CC BY 2.0).
- Video: SpaceX "Falcon Heavy Test Flight" (official YouTube channel) — embedded via the YouTube player, not re-hosted.
Tools
- Charts: Vega-Lite 5.21 + Vega 5.30. Interactives & treemap: D3 7.9. In-browser recompute: Pyodide (Verify layer). Map: Vega-Lite geoshape over a Natural Earth world boundary.